How to analyze spatial transcriptomics data (visium 10x) with R and Python
Organizers: Sonja Hänzelmann, Fabian Hausmann, and Robin Khatri from Institute of Medical Systems Biology, UKE
Organizers: Sonja Hänzelmann, Fabian Hausmann, and Robin Khatri from Institute of Medical Systems Biology, UKE
Spatial transcriptomics represents a seminal development in the field of molecular biology, offering new possibilities for analyzing gene expression patterns within the context of tissue architecture. The Visium 10x platform is a commercially available and widely used platform providing researchers with a toolkit for comprehending cellular biology in its anatomical context.
In this workshop, attendees receive a short introduction to spatial transcriptomics and the Visium 10x platform and a comprehensive hands-on session to understand the data analysis process. The workshop covers key concepts, including data visualization, interpretation of gene expression patterns, and clustering analyses. Overall, this workshop is designed for researchers, students, and technicians who are interested in utilizing the latest advances in spatial transcriptomics and data analysis tools to advance their knowledge of cellular biology. Whether you are a seasoned scientist or a newcomer to the field, this workshop provides a unique opportunity to expand your skills and gain a deeper understanding of this fascinating subject.
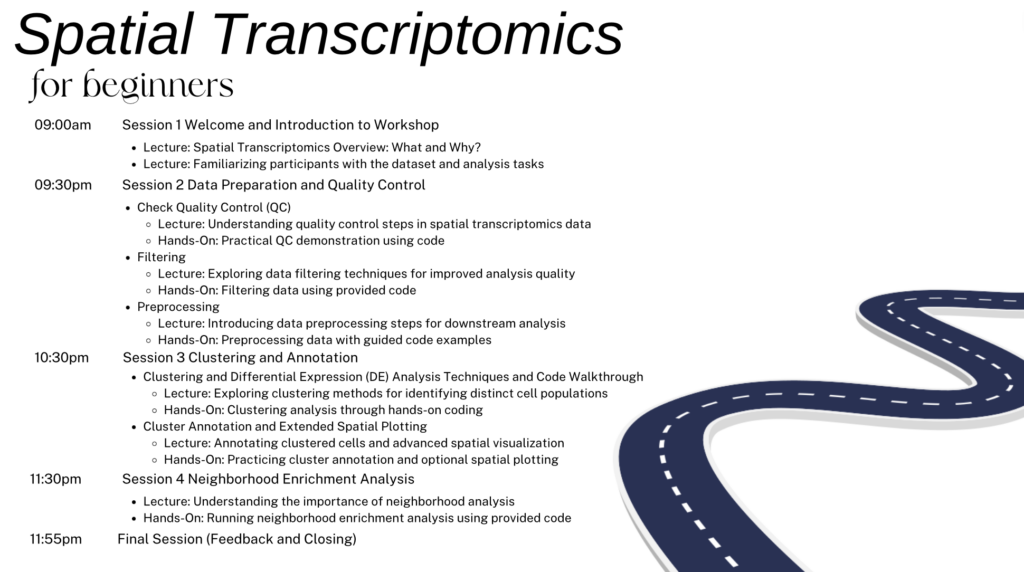
The workshop is organized in two parts:
1. Introduction to spatial transcriptomics, background, and technology
2. Hands-on data analysis using SquidPy, including: annotation, clustering, visualization and enrichment analysis.
The workshop does not require any prior knowledge, but participants are assumed to feel comfortable programming using Python for basic tasks. Attendees have to bring their own laptops.


Stay In Touch